OpenCV #014 Histogram Equalization
Digital Image Processing using OpenCV (Python & C++)
Highlights: In this post, we will learn what an image histogram is and why it is useful. We will also learn about how histogram equalization works and to get practical how to implement it from scratch. Let’s roll.
1. What is a histogram?
When we think of a histogram, we can interpret it as a graphical representation of the intensity distribution of an image. Which simply means, the number of pixels for each intensity value that ranges from 0 to 255.

Let’s take an example of an image and plot the histogram. In the above histogram figure, the \(x-axis\) represents the intensity value (At the left is black, at the right white and in between are different shades of grey). The \(y-axis\) represents the frequency count, which is the number of pixels in an image.
To explain what the histogram shows, it is the number of pixels for each intensity value from 0 to 255, and when there are more pixels, the peak at a certain brightness level is higher than the other.
2. Histogram Equalization
To study how histogram equalization works, let’s take a look at some examples we have prepared below.

On the figure above, here we have a dark image and here we see the histogram beside it. As we see most of the distribution of the pixel value are at the low end of the histogram. There is not a lot of bright values and most of the count are in the low part of the histogram.

On the other hand, here we see a very bright image and most of the count is at the high part of the histogram. So, there is not a lot of pixels with low values.

Here, we see kind of a great low contrast image and then we see that the pixels are actually concentrated in the middle.

While here it’s spread out and much nicer.
Now to define what Histogram Equalization is, it is a technique used for modifying the pixel values in an image to improve the contrast by making those intensities more equal across the board. A good example to show is the difference between the low and high contrast image. In histogram equalization, we want to go from a low contrast plot into a high contrast plot.

Our goal in histogram equalization is to go from a given distribution to a uniform distribution assuming that pixel values can go from zero to \(L – 1\). For example, standard L is 256, so we can go from 0 (dark) to 255 (very bright or white). To get a uniform distribution for the number of counts, what is our goal? We need to perform normalization, so the probability is \(\frac{1}{L-1} \). That’s basically the probability of having a pixel achieve that grey value. So we want to go from the image on the left to the image on the right.
Now if you are ready, we are going to implement our own histogram equalizer in python and c++ from scratch. Let’s dive in!
3. How does it work?
Before starting, we would be working with only a

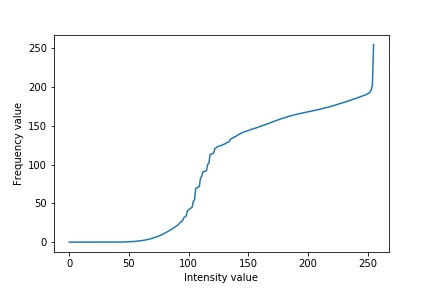
In order to begin processing an image, we must first read in our image using OpenCV. After loading it off the disk, in order to process the image, let’s then flatten it to a one-dimensional array. To let you know, flatten also means concatenating. In our flatten array, we have the intensity value for each pixel. Now that we have a flattened array, the values we have now will range from 0 being black to 255 as white. Everything in between may be considered as a different shade of gray. By looking at the histogram plot, we have spikes close to 110, and also close to 250 and not many values below 50.
Now we have a histogram plot, the next step is to compute the cumulative sum of the elements along a given axis to equalize the intensity values. If you might have forgotten what a cumulative sum is, the sum of all values in the histogram from the start to the end, taking into consideration all the previous values. The mathematical formula for this is:
\(cdf(x) = \sum_{j=0}^{x} h(j) \)

Let’s take a look at the y-axis. If you look carefully we see that the values are huge, 140000. Our next step is to normalize these values to the size of our original image. This should range from 0 to 255, using the formula:
$$ s_{k} = T(r_{k}) = \sum_{j=0}^{k} \frac{n_{j}}{N} $$
Here, \(s_{k}\) is a transform from any pixel value to a new pixel value while \(r_{k}\) is the input pixel and \(T\) is the function that maps \(r_{k}\) to \(s_{k}\).
Now, the general histogram equalization formula is
$$ eh(i) = round(\frac{cdf(i) – cdf_{min}}{M*N – cdf_{min}} * (L-1)) $$
Here the value \(MxN \) are the size of the image and \(cdf\) is the cumulative distribution frequency.

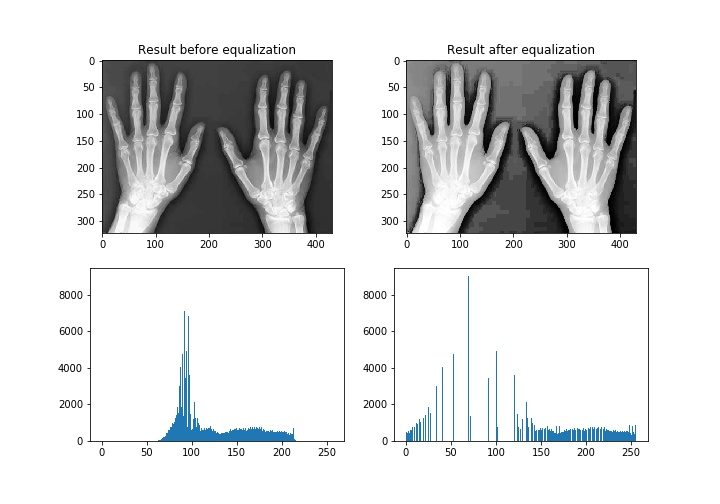
Now our values are normalized between 0 – 255, this is better. For the final part, we can use the normalized cumulative sum to modify the intensity values of our original image.

For the final step, let’s reshape the array to match the original image so we may render the result as an image for visualization. Congratulations, now you are practically an Orthopaedic surgeon now.
The keynote to take away is that the histogram equalization just adjusts the intensities at a global level, taking into consideration all pixels. It is also good to know that this same technique may result poorly on other images. Some other technique to use could be taking neighbouring pixels into consideration instead of using the entire image.
4. Implementation
Python
C++
#include <opencv2/opencv.hpp>
#include <opencv2/core/mat.hpp>
#include <iostream>
#include <math.h>

// namespace
using namespace std;
using namespace cv;

cv::Mat equalizeHist(cv::Mat &img);
cv::Mat calculateHistogramImage(const cv::Mat &src);


int main()
{

	Mat img, hist_img;

    // loaded the image
    img = imread("images/brighter.jpg", CV_LOAD_IMAGE_GRAYSCALE); // FOR WINDOWS USERS "IMAGE_GRAYSCALE"

    if(img.empty()) return -1;

    // Input results
    cv::imshow("Before histogram equalization", img);
    cv::waitKey();

    hist_img = calculateHistogramImage(img);
    imshow("Histogram before equalization", hist_img);
    waitKey(0);


   	// Output results
    cv::Mat img_out, out_img_hist;
    img_out = equalizeHist(img);

    imshow("After histogram equalization", img_out);
    waitKey(0);

    out_img_hist = calculateHistogramImage(img_out);
    imshow("Histogram after equalization", out_img_hist);
    waitKey(0);

}


cv::Mat equalizeHist(cv::Mat &img){
    // Total number of occurance of the number of each pixels at different levels from 0 - 256
    // Flattening our 2d matrix
    int flat_img[256] = {0};
    for(int i=0; i<img.rows; i++){
        for(int j=0; j<img.cols; j++){
            int index;
            index = static_cast<int>(img.at<uchar>(i,j)); // safe convertion to int
            flat_img[index]++;
        }
    }

    // calculate CDF corresponding to flat_img
    // CDF --> cumsum
    int cumsum[256]={0};
    int memory=0;
    for(int i=0; i<256; i++){
        memory += flat_img[i];
        cumsum[i] = memory;
    }

    // using general histogram equalization formula
    int normalize_img[256]={0};
    for(int i=0; i<256; i++){
    	// norm(v) = round(((cdf(v) - mincdf) / (M * N) - mincdf) * (L - 1));
        normalize_img[i] = ((cumsum[i]-cumsum[0])*255)/(img.rows*img.cols-cumsum[0]);
        normalize_img[i] = static_cast<int>(normalize_img[i]);
    }

    // convert 1d back into a 2d matrix
    cv::Mat result(img.rows, img.cols, CV_8U);

    Mat_<uchar>::iterator itr_result = result.begin<uchar>(); // our result
    Mat_<uchar>::iterator it_begin = img.begin<uchar>(); // beginning of the image
    Mat_<uchar>::iterator itr_end = img.end<uchar>(); // end of the image

    for(; it_begin!=itr_end; it_begin++){
        int intensity_value = static_cast<int>(*it_begin); // get the value and cast it into an int
        *itr_result = normalize_img[intensity_value];
        itr_result++;
    }


    return result;
}

cv::Mat calculateHistogramImage(const cv::Mat &img){
    // calculate histogram
    int histSize = 256; // size of the histogram
    float range[] = {0, 255}; //begin and end
    const float* histRange = {range};
    Mat hist_img;
    calcHist(&img, 1, 0, Mat(), hist_img, 1, &histSize, &histRange);

    // draw
    cv::Mat dst(256, 256, CV_8UC1, Scalar(255));
    float max = 0;
    for(int i=0; i<histSize; i++){
        if( max < hist_img.at<float>(i))
            max = hist_img.at<float>(i);
    }

    float scale = (0.9*256)/max;
    for(int i=0; i<histSize; i++){
        int intensity = static_cast<int>(hist_img.at<float>(i)*scale);
        line(dst,Point(i,255),Point(i,255-intensity),Scalar(0));
    }
    return dst;

}

Summary
To sum it up, as you can clearly see from the images that the new image contrast, has been enhanced and its histogram has also been equalized. Also, one more thing to note is that when performing histogram equalization the shape of the histogram original image would change. In the next post, we would talk about Perspective Imaging.


