OpenCV #009 Line Detection Using Hough Transform
Highlights: In this post, we will learn how to analyze images and detect basic features: lines! We will describe a well known Hough transform that will help us to do this task. Let’s roll!
Tutorial Overview:
1. Line Detection
Human driver on a regular day performs lane detection. This is a crucial task in order to keep the vehicle on a lane. The same technique is also applied in the autonomous industry with self-driving cars and performing lane detection is possible with computer vision techniques. So, sit tight, cause this is going to get a lot more interesting.
In many applications of Computer Vision, we want to detect objects and to recognize them. We have already explained how we can detect edges using OpenCV. Here, we would continue from these ideas and explain how we can detect lines.
Our first approach in line detection can be the basic brute search method. We can scan a large number of pixels and ask if they belong to the same line. You might be thinking is this not computationally expensive? Yeah, you are right. Even with very fast computers checking for every possible line on an image requires a lot of time. We want to somehow allow the data to decide where the line is. Let’s see a toy example where we detect a line in an image. In the Figure below, we have marked in green all the lines that we would like to detect.

2. Hough Space
We are going to take you through the main idea of line detection. The main concept of the Hough transform is an understanding of Hough space.

Let’s say we have a line in an image space represented by the equation \(y= m_{0}x+b_{0}\). Given this line, we want to represent it as a point in Hough space with the parameters \(m \) and \(b \). In other words, the line in the image space should correspond to a point in Hough space.
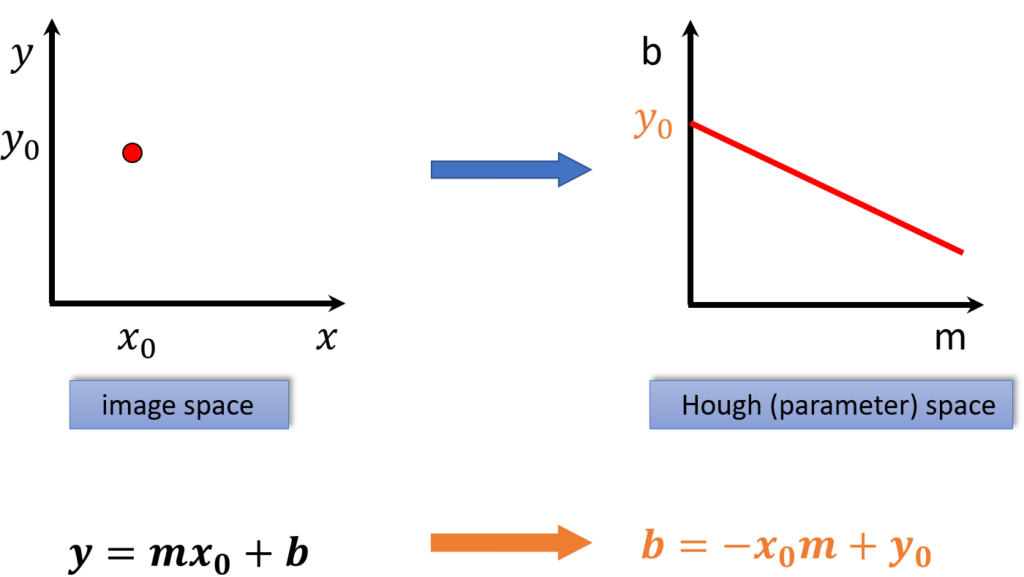
With that being said, we are going to do something different. Imagine that we have a point represented as \(x_{0}\), \(y_{0} \) in the image space. We are going to derive the equation of that line that goes through the point in order to satisfy the equation \(y_{0}= m_{0}x+b_{0}\). As an illustration, we put in another point in the graph \(x_{1} \), \(y_{1} \). Yet, it is simply another line in Hough space.
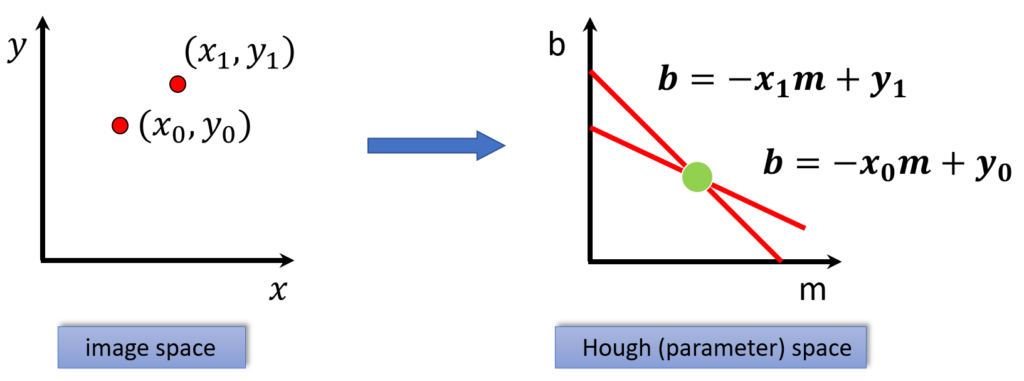
Now, the question is, what line is consistent with both points? Certainly, it has to be the line that corresponds to a point of intersection in Hough space. As shown above, that is how we are going to identify lines from points. To put it differently, every point in the image space gives us a line in Hough space. Let’s view another image below.
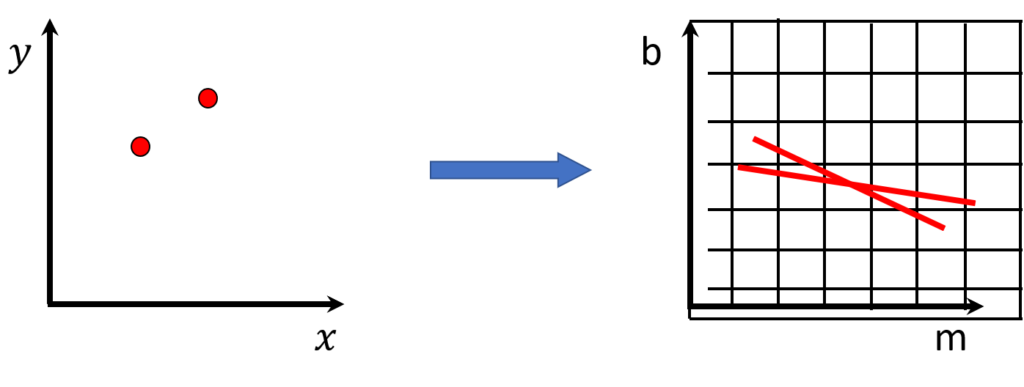
A grid in \(m \) and \(b \) space is being created. Once every point casts a vote, every vote are taken into consideration and whatever bin has the most votes, that is our line.
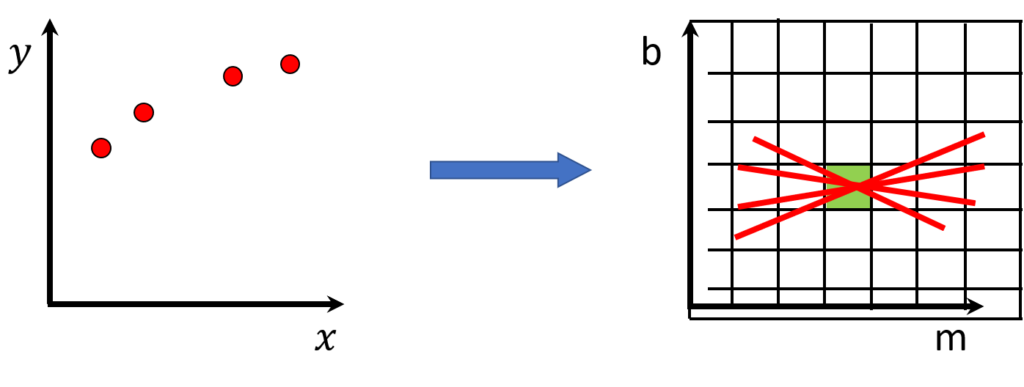
To clarify this, let’s say in the real world during the presidential election in any country, voters are given the chance to vote for any number of candidates of their choice and the candidate with the most
3. Polar Representation for Lines
Before continuing, if we carefully analysed our representation of lines, we detect some flaws using the \(m \) and \(b \) representation of lines. To clarify, vertical line, concerning \(m=infty \). With this in mind, have this perception of an infinite slope can be very painful, which leads us to come up with a much powerful representation of line called the “Polar representation for lines”. Not to mention, we do not have any bad numerical problems. In this representation, the \(red line \) is going to be defined by two quantities.
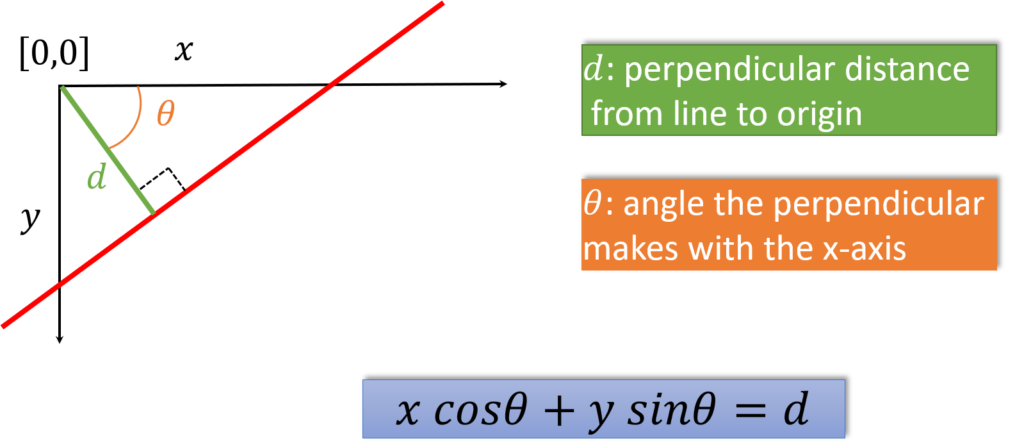
One of them is the perpendicular distance. This is the distance to the closest point on the line to the origin, \(d \). Along with the second parameter \(theta \), which is the angle, the perpendicular makes with the \(x \) axis. Now, we have a polar representation of the angle and distance. You can read more about polar line representation here.
4. Code for Detecting Lines in Python and C++
The HoughLineP() function finds circles on grayscale images using a Hough Transform.
- image – The output from the edge detector. This is a grayscale image.
- rho – Distance resolution in pixels of the Hough grid which is the parameter \(d \).
- theta – Angular resolution in radians of the Hough grid which in our case is \(theta\).
- threshold – Minimum number of votes (intersections in Hough grid cell)
- minLineLength – Minimum number of pixels making up a line.
- maxLineLength – Maximum gap in pixels between connectable line segments.
Python
C++
#include <opencv2/opencv.hpp>
#include <iostream>

using namespace cv;
using namespace std;

int main()
{
    // Declare the output variables
    Mat edgeImage, orginalImageWithHoughLines;

    // Loads an image
    Mat image = imread( "road.jpg", IMREAD_GRAYSCALE );

    // Check if image is loaded fine
    if(image.empty()){
        printf(" Error opening imagen");
       return -1;
    }

    // Apply the Guassian Blur filter to smooth the image
    cv::Mat image_gaussian_processed;
    cv::GaussianBlur(image, image_gaussian_processed, Size(5,5), 1);

    // Edge detection
    Canny(image_gaussian_processed, edgeImage, 50, 120, 3);

    // Copy loaded image to the initial image so that will display the results in BGR
    cvtColor(image, orginalImageWithHoughLines, COLOR_GRAY2BGR);

    // Declaring some constants for the parameters
    int dis_reso = 1;
    double theta = CV_PI/180;
    int threshold = 170;

    // Standard Hough Line Transform
    vector<Vec2f> lines; // will hold the results of the detection
    HoughLines(edgeImage, lines, dis_reso, theta, threshold, 0, 0); // runs the actual detection

    // Draw the lines
    for( size_t i = 0; i < lines.size(); i++ )
    {
        float rho = lines[i][0], theta = lines[i][1];
        Point pt1, pt2;
        double a = cos(theta), b = sin(theta);
        double x0 = a*rho, y0 = b*rho;
        pt1.x = cvRound(x0 + 1000*(-b));
        pt1.y = cvRound(y0 + 1000*(a));
        pt2.x = cvRound(x0 - 1000*(-b));
        pt2.y = cvRound(y0 - 1000*(a));
        line( orginalImageWithHoughLines, pt1, pt2, Scalar(0,255,00), 3, LINE_AA);
    }

    // Show results
    cv::imshow("Original image", image);
    cv::imshow("Detected Lines (in Green) - Standard Hough Line Transform", orginalImageWithHoughLines);
    // Wait and Exit
    waitKey(0);

    return 0;
}
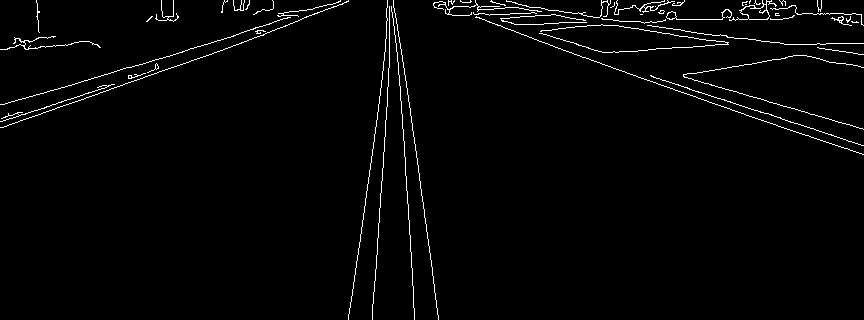
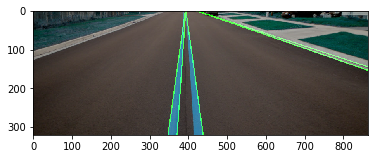
These two images below are created using the code found in this link here. You may also find a detailed explanation of how these hough peaks are produced here.

Summary
Detecting lines on a given image is important in the autonomous industry. To sum it up, we have learnt about where line detection can be performed along with some good examples. We also talk about 2 different representations of lines. The straight line and also the polar representation for lines. In the next posts, we will talk more about how to detect circles in an image.


