#010 TF TensorBoard: Visualizing Learning
Highlights: In this post we will learn what is TensorBoard and how to use it. For most people, neural networks can sometimes be a bit of black box. Debugging problems is also a lot easier when we can see what the problem is. Thankfully, TensorBoard is a tool that will help us to analyze neural networks and to visualize learning.

Tutorial Overview:
Intro
The idea of TensorBoard is to help to understand the flow of tensors in our model in order to debug and optimize the model. TensorBoard is a way to visualize the training of the model over time and most of the time it used for watching accuracy versus validation accuracy and loss versus validation loss.
In order to do this, we will utilize a simple model for classification of handwritten digits from MNIST dataset. It is going to have a flatten layer, as well as two fully connected layers with a dropout.
1. Sequential API
The first thing to do is to import all required libraries, dataset and to define a model.
The easier way to do this is to use Sequential API. This allows us to define a model layer-by-layer.
When using Sequential API, we are able to use fit method for training. The easiest way to track the accuracy and loss during training is to use Keras callbacks. They can be accessed by tf.keras.callbacks.TensorBoard and they allow us to interface with TensorBoard
The interactive Colab notebook can be found at the following link
So the last command will open a TensorBoard in our notebook, or in a new browser tab, based on your preference.
So here, we have visualized all the graphs together, including train and validation accuracy and loss over epochs on x-axis, and actual value on y-axis.
Now we can expand our graph, remove the y-axis and zoom by drawing a rectangle to better examine some specific part. We can also change what is displayed on x-axis, where step shows steps on x-axis, relative shows the time relative to the first data point and the wall options shows the actual time the runs happen. To change how smooth our line is, we can change the amount by sliding the smoothing slider.

When using the Keras callback, we have train and validation showing up on the same charts. This makes it easier to detect things like over-fitting.
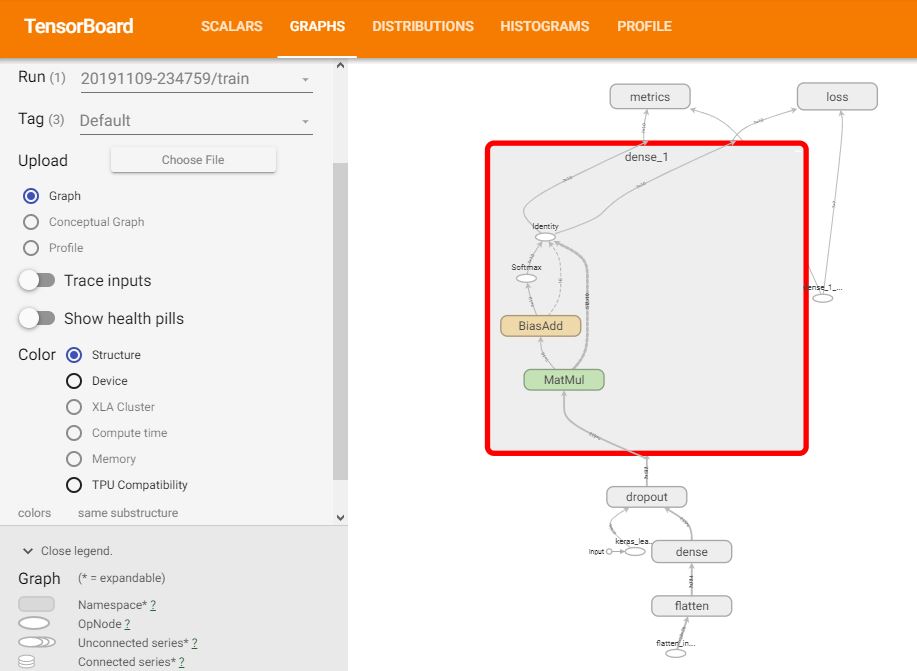
One of the advantages of creating TensorBoard records using the Sequential API is that we can easily visualize our model. For this, click on Graphs tab. By default, we will see an op-level graph, which helps us to understand how TensorFlow understands our program. Examining the op-level graph can give us insight as how to change our model.

The direction of the arrows show which way the tensors are flowing. To better inspect layers, they can be expanded by double-clicking on a specific one.

To ensure the graph matches the structure of our model, we need to switch to Keras tag and choose Conceptual Graph. Here we can see that the graph really matches our model.

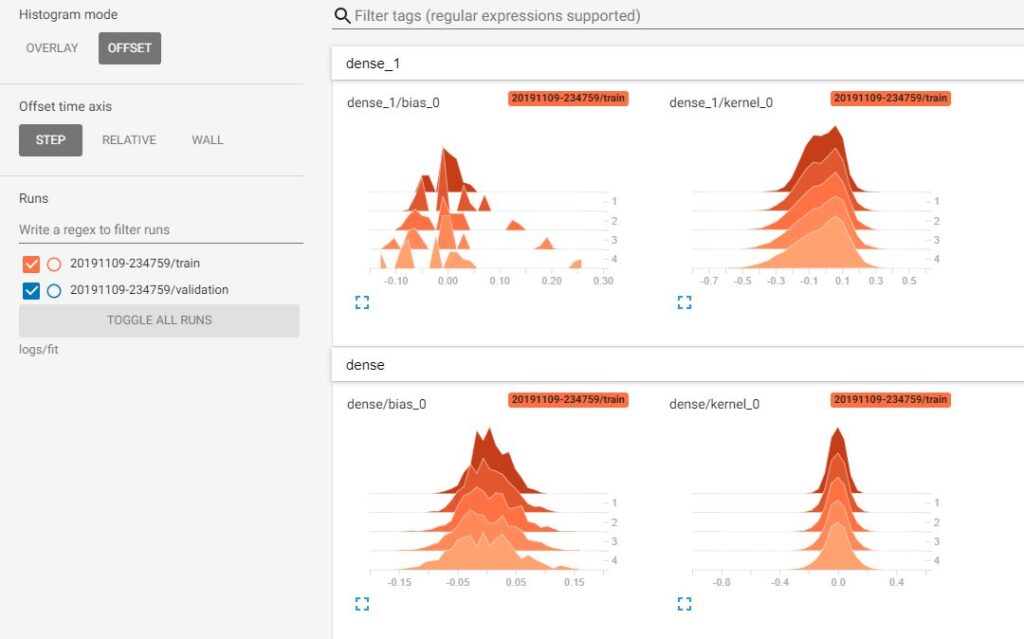
Next, we have the Distributions dashboard. Here we can view the distribution of each weight. The lighter part shows all the weight across time and the shaded part shows weights that are actually activated.

Let us move to Histograms dashboard which displays how the distribution of some tensor in our TensorFlow graph has changed over time. This is achieved by showing many histograms at different time points.

2. Model Subclassing
So, this was the first way to do this, also the easiest one. The other way to build a model is to use model subclassing with Keras. The model class is the root class used to define a model architecture. This method gives us more possibility to customize the model and to implement our own forward-pass. Let’s see the code.
The interactive Colab notebook can be found at the following link
Here, we are just showing scalars and graphs, as they are of more importance for us. This time, we have implemented a convolutional neural network, so we can see how it looks like.

By opening the conv2d layer, we can better see the structure.

Note that paths for logs are looking different, where on the Windows side, we have \(\setminus \setminus \) to separate the folders, while on Linux (also on Google Colab) we are using only \(/ \).
Summary
To summarize, we have learned how to use TensorBoard with TensorFlow 2.0, both by using Sequential API and model subclassing. In the next post, we will show a few techniques which can be useful to prevent overfitting with a use of TensorBoard.


